|
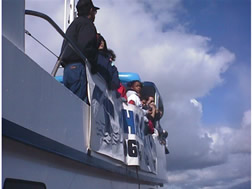
 Students in
Santa Barbara collected whale watching data in the Santa Barbara Channel. During the month of
February, they collected data on whale sightings from various points on shore. During the month of May, they
again collected data on whale populations during a boat trip to Santa Cruz Island, one of the Channel
Islands off the California coast. For each of those months, the students kept track of all
the whales and dolphins they saw. They wrote down the type and numbers of animals, along with the location
of the sightings (latitude and longitude). Students in
Santa Barbara collected whale watching data in the Santa Barbara Channel. During the month of
February, they collected data on whale sightings from various points on shore. During the month of May, they
again collected data on whale populations during a boat trip to Santa Cruz Island, one of the Channel
Islands off the California coast. For each of those months, the students kept track of all
the whales and dolphins they saw. They wrote down the type and numbers of animals, along with the location
of the sightings (latitude and longitude).
You may be wondering why we would want this type of data. Data like this are used to answer
questions, and to help make decisions. For example, we can use the data collected to answer questions such
as "Which mammals are seen and when?" or "Do some types of mammals show up in higher numbers than others?"
People in charge of making decisions about natural resource management also use this type of information to learn whether
marine mammal populations and increasing or decreasing, and sometimes to help decide whether certain animals should be protected.
Learn about the data collected, the graph results, and mapping whales:
Whale Data
Mapping Whales
Back to Data Domain
|