Bar Graphs: "like stacks of coins"
Bar graphs are great for looking at differences
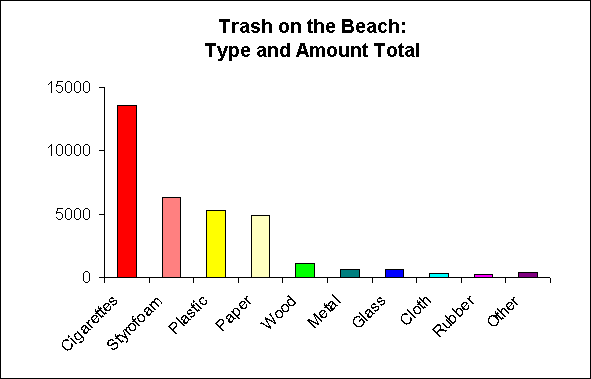
amongst similar things. Let's say we want to look at the number of pieces of different kinds of trash found at the beach . We want to know which kinds are found the most often and the least often.
Bar graphs are great because you can line up different types of things right next to each other and compare them instantly. For example, the kinds of trash found are lined up on a horizontal axis in the bar graph below. The numbers indicating pieces of trash found are lined up on a vertical axis. The height of each bar can tell you the number of pieces of trash of that kind that were found. Bar graphs are good for giving a comparison
of absolute numbers.

Back to Graph Types Overview |
|

